
DesiPropVERSE: Explore Bangalore's Property Market in 3D, From Lakes to Land Rates
A complete guide to DesiPropVERSE, the 3D property world of Bengaluru: projects, AlphaScores, lakes, drains, metro, land rates and GeoVerify on one map.
DesiAcres Editorial · 17 November 2026 · 8 min read
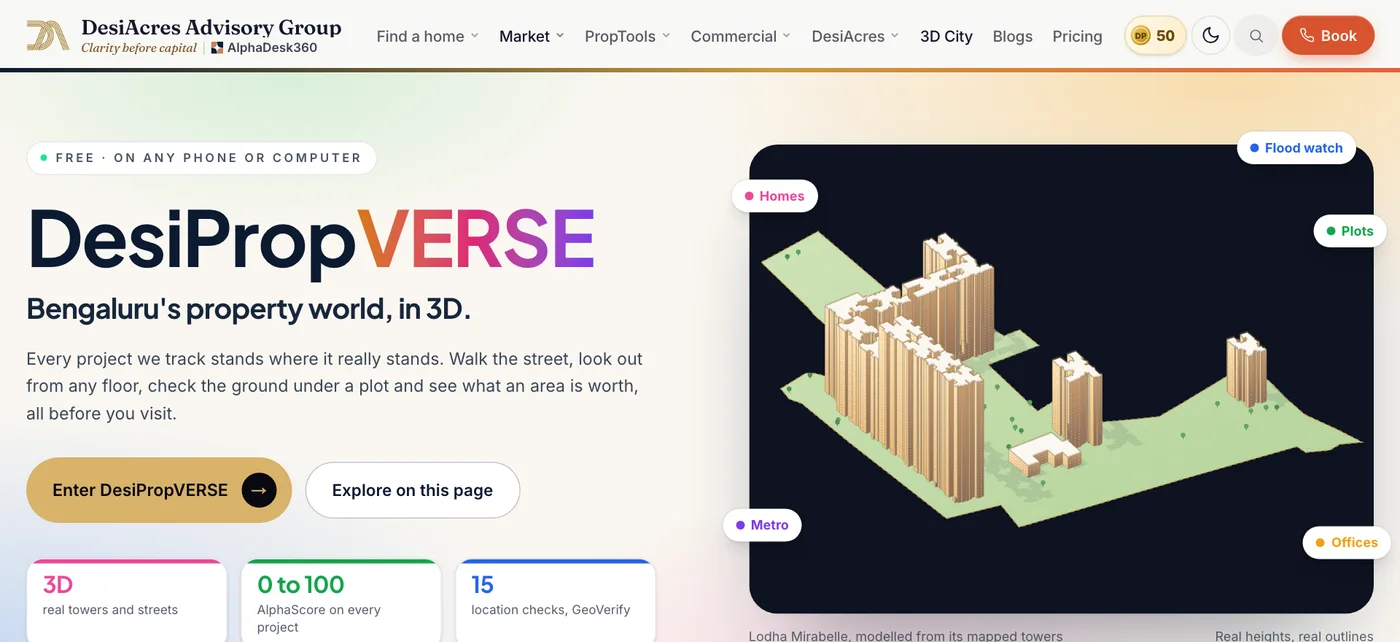
- DesiPropVERSE is a 3D map of Bengaluru where projects, scores, lakes, drains, the metro, land villages and rents sit on one screen.
- You can fly over the city, stand at a tower on the floor you choose, walk the streets and screen any spot with GeoVerify.
- Projects with a mapped site show on the map. Where we have no mapped boundary, a project is shown as a beacon and never drawn as an invented building.
- Real towers come from open building outlines and heights, so they are approximate models, not architects' drawings.
Most property searches in Bengaluru still happen on a list: a column of cards with prices and a few photographs. A list cannot show you that the tower you like is a short walk from a lake and a flood-prone drain, that the metro line passes on the other side of a river of traffic, or that the area next door has better scores for less money.
DesiPropVERSE puts those things on a map you can tilt, fly over and stand inside. This guide shows what it contains, how to use it, and what it is honest about.
What DesiPropVERSE is
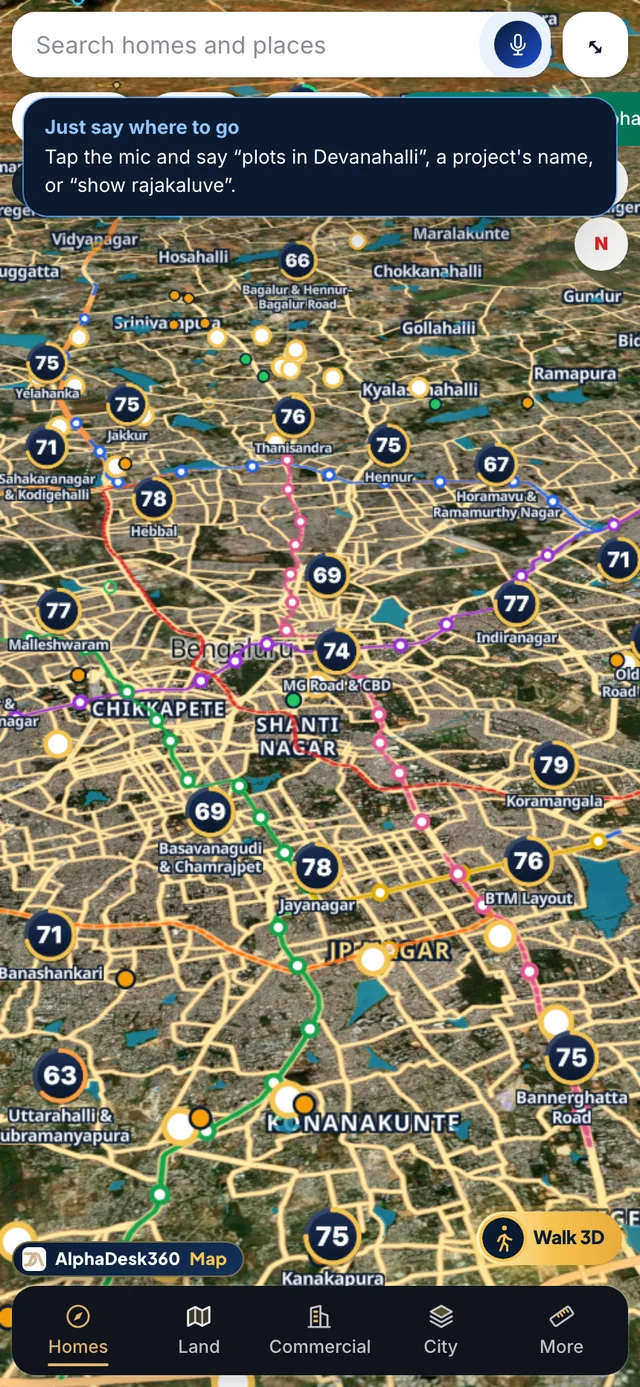
DesiPropVERSE is the 3D property world of Bengaluru from DesiAcres. It opens at desiacres.com/desipropverse as a full-screen map. Every project we list is placed where it stands, coloured by its stage, and carries an AlphaScore. Around it sit the things that decide whether a home is a good one: lakes and drains, roads and frontage, the metro, schools, shops, land villages and rents.
The word "metaverse" is easy to oversell, so here is our meaning. It is a shared, explorable 3D model of the city's property market, built from real data, where you can see a place before you visit it. It is not a game and it is not a headset product. It runs in a normal browser on a phone or a computer.
Fifteen things you can do on the map
| What you want | What to use | What you see |
|---|---|---|
| Find a project fast | Search any place, project or street | The map flies to it in 3D |
| Judge a project at a glance | Live AlphaScores | A score over every project, area and pincode, coloured by strength |
| Know if it is ready | Stage beacons | Green for ready to move, amber for under construction, cyan for plots |
| Screen a location | GeoVerify | 15 location checks, the revenue village and a PDF report |
| Check the view | View from any floor | A look out across the city from the floor you choose |
| Check for water risk | Lakes, streams and drains | Every mapped lake, stream and storm-water drain |
| See civic trouble spots | Civic watch | Cards over areas with flood or waterlogging history and water stress |
| Understand the metro | Metro layer | Running lines and stations, with dashed lines for those under construction |
| Find land by size | Land Finder | Place a parcel from 1,000 square feet to many acres and see what surrounds it |
| Understand land prices | Land Atlas | Revenue villages with Bhoomi codes and an estimated land rate |
| Compare rents | Rent by pincode | Average rent per square foot and per month for homes and shops |
| See roads | Road frontage | How much of a boundary runs along a mapped road, in feet |
| Feel the street | Walk the streets | Street-level walking with the keys or sticks |
| See the day and night | Night mode | Mapped roads with street lights and towers glowing |
| Read the heat | Thermal map | Price, growth, flood risk and water stress as colours |
A five-minute walk-through
Here is a simple route that shows how the pieces connect.
- 1Open the map and search for your office. It flies there in 3D. Note the roads and the metro nearby.
- 2Switch on the stage beacons. See which projects around it are ready, which are under construction and which are plots.
- 3Turn on the AlphaScore layer. The colours show where scores are strong and weak. Tap a project to see its score and what drives it. See AlphaScore explained.
- 4Turn on lakes, streams and drains. Look at the project you like. How far is the nearest water, and where does the drain run?
- 5Tap the project and open GeoVerify. It screens the location against open data and gives you a report.
- 6Stand at the tower and choose a floor. Look out in every direction. This shows what the view might be like, as an indication.
- 7Check the land and rent layers. See the village, its estimated land rate and the rents nearby.
- 8Walk the last stretch. Drop to street level and walk toward the shops, the school and the metro.
In five minutes you have seen the project, its neighbourhood, its risks and its commute, without leaving your chair. That is the point: it narrows your list before you spend a Saturday on site visits.
Why 3D changes decisions
A flat map hides height, slope and distance. 3D brings three things back.
- Context. A tower is one building among others. 3D shows what it faces, what blocks its view and how tall the neighbours are.
- Distance you can feel. A lake that is 400 metres away looks close on a map and far in a car. Walking the streets in 3D gives a better sense of the real route.
- Comparison. Colours across the whole city show where prices, growth, flood risk and water stress sit relative to each other, which a list cannot do.
For a deeper read of the idea, see our posts on 3D property mapping for home buyers and digital twins in real estate.
For three kinds of buyer
A flat buyer
Use the map to shortlist projects on commute and surroundings, then run each through the Property Check. Open the Commute Finder for door-to-door time to your office. The map shows the neighbourhood, while the check judges the price.
A plot buyer or landowner
The Land Finder places any parcel on the map and shows the zones, roads, schools and shops around it, with an indicative value. Plotted layouts show typical plot sizes with internal roads and parks inside mapped parcels, as a sample layout and not a sanctioned plan. Pair it with the plot approval check.
An investor or NRI
Fly across corridors, compare scores and rents by pincode and look at the metro lines running and under construction. For a remote buyer, this is a way to understand the neighbourhood before a family member visits. See the NRI checklist.
What is on the real map and what is not
We hold ourselves to a rule: no invented data.
- Mapped sites only. Where we have a mapped project site, it appears on the map. Where we do not, the project shows as a small marker or beacon at the area, and we never draw a building that does not exist.
- Towers are approximate. Real towers are built from open building outlines and heights, and from published floor counts where we have them. They are models for orientation, not architects' drawings.
- Frontage and layouts are indicative. Road frontage is measured on mapped boundaries and roads. Plotted layouts are examples, not sanctioned plans.
- Planning boundaries. Some planning area boundaries are not published as open data, so they are shown as indicative.
- Estimates are labelled. Land rates and values are estimates from the data we hold, and each says so.
Honesty here is a feature. A map that looks complete and is partly invented is worse than one that shows its gaps.
The Architecture Studio
For people who want to look inside a building, DesiPropVERSE has a separate Architecture Studio at the studio. It adds workspaces, section cuts, exploded views, line-of-sight and floor isolation for a tower. These are design tools for exploring a building, kept apart from the real-map layers so one does not blur into the other.
How it connects to the rest of DesiAcres
DesiPropVERSE is the front door to several tools.
- GeoVerify for location screening.
- AlphaX AI to ask about anything you see.
- AR to place a project in your room.
- The Market dashboard for prices and growth.
Tips for using it on a phone
- Use two fingers to tilt and rotate.
- Search first, then explore. The map flies to the place.
- Turn on only the layers you need, so the map stays readable.
- On a slow connection, give the city a moment to load.
- Use the full-screen bar to expand the map when you want to focus.
Frequently Asked Questions
What is DesiPropVERSE?
DesiPropVERSE is a 3D map of Bengaluru from DesiAcres that places projects, AlphaScores, lakes, drains, the metro, land villages and rents on one explorable screen, in a normal web browser.
Is DesiPropVERSE free?
You can open and explore the map for free. Some deeper reports and tools may have separate terms, which are shown where they apply.
Are the 3D buildings real?
Real towers are approximate models built from open building outlines and heights, and published floor counts where available. They are for orientation. Where we have no mapped site, a project is shown as a beacon, not a drawn building.
Can I check flood and lake risk on it?
You can see mapped lakes, streams and storm-water drains and screen any location with GeoVerify. It is a screening from open data and not a legal or engineering clearance.
Does it work on a phone?
Yes. It runs in the browser on phones and computers, with touch controls for tilt and rotate.
Do I need a VR headset?
No. DesiPropVERSE needs only a browser.
- DesiAcres, DesiPropVERSE (desiacres.com)
- OpenStreetMap contributors (openstreetmap.org)
- OpenCity, Bengaluru open data (opencity.in)
Written by DesiAcres Editorial at DesiAcres Advisory Group, a Bengaluru buyer-side property advisory. General information, not legal or investment advice.
Run it through the free 15-point check, price vs comparables, red flags and a clear verdict.
Check a property →